Terrain Atlas and Visual Analysis DSS system
Thomas Butkiewicz, Xiaoyu Wang, Zachary Wartell, and William Ribarsky
Charlotte Visualization Center, UNC Charlotte
For downloadable content including data and software
please contact Dr. Xiaoyu Wang
Abstract
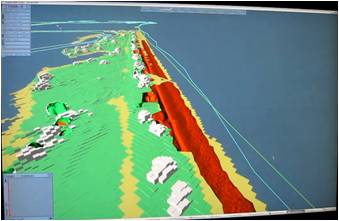
To provide a common picture across multiple models, we have developed an integrated probe-based visualization to bring interactivity to analysis coastal infrastructure changes. We developed a data model and a database structure to organize and permit retrieval of comprehensive collections of LIDAR scans over time. With a geographic viewer developed for the purpose, one can identify and retrieve multiple scans from different times, which in coastal areas are often overlapping in whole or in part. The LIDAR data can be retrieved as a point cloud or as a polygonal terrain model at any selected resolution. LIDAR scans at the same location for different times can be compared to quickly calculate and display changes. This tool is currently provided to our collaborators’ groups. Our longer range plan is to work with Gavin Smith to make the atlas available to other members of the DIEM team and to customers such as FEMA and NOAA.
Our terrain change tool uses a fast image processing based algorithm to identify those areas containing significant changes while still using the raw data points for each of these areas for the 3D change models. We developed a data processing software pipeline for ingesting terrain data from NOAA’s digital coast (or any other comprehensive dataset). These data contain LIDAR surveys of the NC coast for multiple dates, which overlap in irregular ways. These datasets are very high resolution, often with sub-foot sample point spacing, leading to terabytes of storage. Through the interactive visual interface, user picks a region to focus on, and the software retrieves those portions of the datasets from disk. These terrain analyses are being augmented so that, by user feature identification methods and combining the tools with road grids, county boundaries, and other GIS information, we can determine what parts of the built infrastructure will be affected by a large scale natural disaster and when.
Although state-of-the-art, our tools are fitted with readily usable user interfaces so that users can quickly and effectively produce animations, narratives, and analyses of the unfolding effects of a natural disaster for their own purposes. We have put the tools in the hands of fellow DIEM researchers (e.g., Rick Luettich’s and Pat Fitzpatrick’s groups). We are planning to share with other researchers and with the developers of disaster prevention and evacuation planners. To this end, we are running studies using the tools to demonstrate how they can be used effectively for planning and response.
Video and Images
Part 1:
Part 2: