Linked Geospatial Feature-Space Analysis
Isaac Cho, Xiaoyu Wang, Zachary Wartell
Charlotte Visualization Center, UNC Charlotte
Abstract
Building on our Terrain Atlas and Visual Analysis DSS system, we have also developed an semi-immersive visual analytics environment that will permit terrain feature identification and extraction. Terrain features such as buildings, roads, bridges, trees and other vegetation, dune structures, excavations or build-up (e.g., scouring under a bridge or build-up around a new road) can be characterized by the user using an interactive interface and then used to automatically find and analyze these features. Using the ability from the Terrain Atlas to compare terrain scans at different times, changes in these features over time can also be identified. The goal for this application is to integrate terrain feature space with our previous terrain analysis project to structurally detect the terrain changes or the impacts of natural disasters (e.g., hurricane, storm surge, and flooding). This application provides interactions for creating multiple scatter-plots of the LIDAR points plotted on derived axes, such as point height and local gradient. This system can help depicting and determining what coastal features and infrastructure might be affected during severe storms.
In this application, we are experimenting with interactive transfer functions that allow users to automatically identify and classify changes across a much broader collection of natural and man-made features, such as beaches, dunes, washouts, houses, roads, docks, etc. Selecting regions in these scatter plots highlights the corresponding LIDAR points in the 3D view. The user can create a series of plots and linked plots using logical operators. In the future, we will further integrate this feature extraction software with temporal event structures Dr. Lu and her group have presented, and evaluate the effectiveness of such integration of their potential to classify detected changes and terrain features, as well as to provide meaningful measurements to domain experts, e.g. a dune’s ability to resist washout.
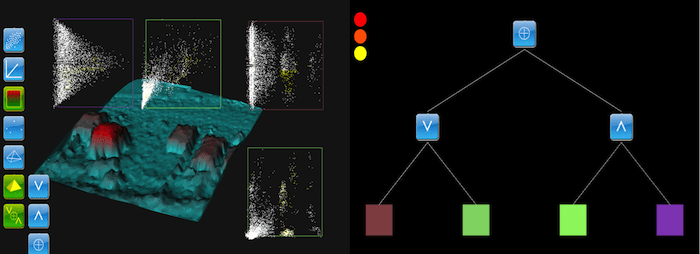
As shown in the figure above, the central image is a patch of coastal LIDAR data. The user has created four scatter plots of the sample points on various gradient measures and then selected regions in the plots. (The red boxes denote the user’s selections). This has caused mostly house structures to be highlighted in blue in the 3D view. These highlighted regions in the scatter plots constitute a “statistical signature” that is tightly correlated with the feature “house” in the LIDAR sample points. Conversely, the structures on the LIDAR terrain can be selected, highlighting the corresponding regions in the scatter plots. Using both techniques, signatures for different features can be quickly developed and then used to automatically find these features in extended LIDAR datasets. At present, we have applied this application to a single LIDAR time-step; however it will also be important for analyzing the change models extracted by the system described below, and we plan to bring the two capabilities together. Then, for example, we can follow changes in road features, embankments near bridges, and other features over time.
Furthermore, we have created a semi-immersive, desktop VR tool for visual analysis of terrain features. The tool uses a commodity stereoscopic display with head-tracking and two 6 degree-of-freedom button-ball input devices in addition to the standard keyboard and mouse. The user views a 3D model of a patch of terrain in stereoscopic 3D and he can navigate in 3D using button-ball devices. The navigation technique uses a scene-in-hand metaphor . The screen contains a variety of 2D scatter plots that plot various geometric statistics extracted from the terrain patch. The terrain patch is assumed to be a height-field, tessellated using a non-uniform triangular mesh. The height-field assumption simplifies the calculation of geometric statistics such as average local slope, degree of roughness, maximum local slope, etc. The scatter plots exist as 3D objects that can be repositioned manually or automatically within the displayed environment and generally will appear in front of the terrain patch displayed at the screen center.